Every founder asks the same question of their CFO: "How do we know we're winning?" The honest answer is 20 numbers & not 200, not 2 that a CFO watches every week. Cash runway. Bqurn multiple. DSO. Gross margin. Net revenue retention. Rule of 40. EBITDA margin. Forecast accuracy. The list goes on, but it's finite.
These are the financial KPIs every CFO should monitor in 2026 — and the ones every founder should be fluent in, even without building the dashboard themselves. With capital more expensive and investor diligence tighter than it was two years ago, these 20 KPIs are the shared language of boards, investors, and acquirers. Learn them and decisions get faster. Track them weekly and fundraising gets easier. Ignore them and every other finance discipline quietly weakens underneath you.
This is the CFO-level KPI playbook we install with founders and finance teams at Jordensky.
The 20 Financial KPIs a CFO Should Watch Every Week
| # | KPI | Category | Why It Matters |
|---|---|---|---|
| 1 | Cash Runway (months) | Cash | Time until you need to raise or cut |
| 2 | Net Burn Rate | Cash | Speed cash is leaving the business |
| 3 | Cash Conversion Cycle (CCC) | Cash | Days cash is locked in operations |
| 4 | DSO (Days Sales Outstanding) | Cash | Collection speed |
| 5 | DPO (Days Payable Outstanding) | Cash | Vendor payment cycle |
| 6 | Gross Margin % | Profitability | Whether the model scales |
| 7 | Contribution Margin % | Profitability | Per-unit economics |
| 8 | EBITDA Margin % | Profitability | Operating profitability |
| 9 | Operating Cash Flow | Profitability | Real cash generated from operations |
| 10 | Revenue Growth Rate (%) | Growth | Top-line velocity |
| 11 | ARR / MRR (for SaaS) | Growth | Real-time recurring revenue |
| 12 | Net Revenue Retention (NRR) | Growth | Expansion vs. churn in the existing book |
| 13 | Customer Concentration | Growth Quality | Risk sitting in the top 10 accounts |
| 14 | OpEx % of Revenue | Efficiency | Operating leverage |
| 15 | Revenue per Employee | Efficiency | Team productivity |
| 16 | Working Capital Turnover | Efficiency | How hard working capital is working |
| 17 | Rule of 40 | Capital Efficiency | Growth + profit balance |
| 18 | Burn Multiple | Capital Efficiency | Burn per ₹ of new ARR |
| 19 | Forecast Accuracy (%) | Discipline | Quality of the finance function itself |
| 20 | Compliance Notice Count | Risk | Regulatory health |
Why Founders Should Care About Their CFO's KPIs
- Investors speak this language. Board meetings, term sheet negotiations, and exit conversations all anchor to these 20 KPIs. A founder who can't answer "what's your Burn Multiple this quarter?" in 30 seconds loses credibility in the room.
- Decisions get cheaper. Pricing, hiring, vendor choices, fundraising timing every operating decision compounds off these numbers. Founders who track them make faster, better-informed calls.
- The finance function gets respected. When a founder reads the dashboard every week, the finance team raises its own bar. When the founder doesn't, the dashboard quietly drifts out of date.
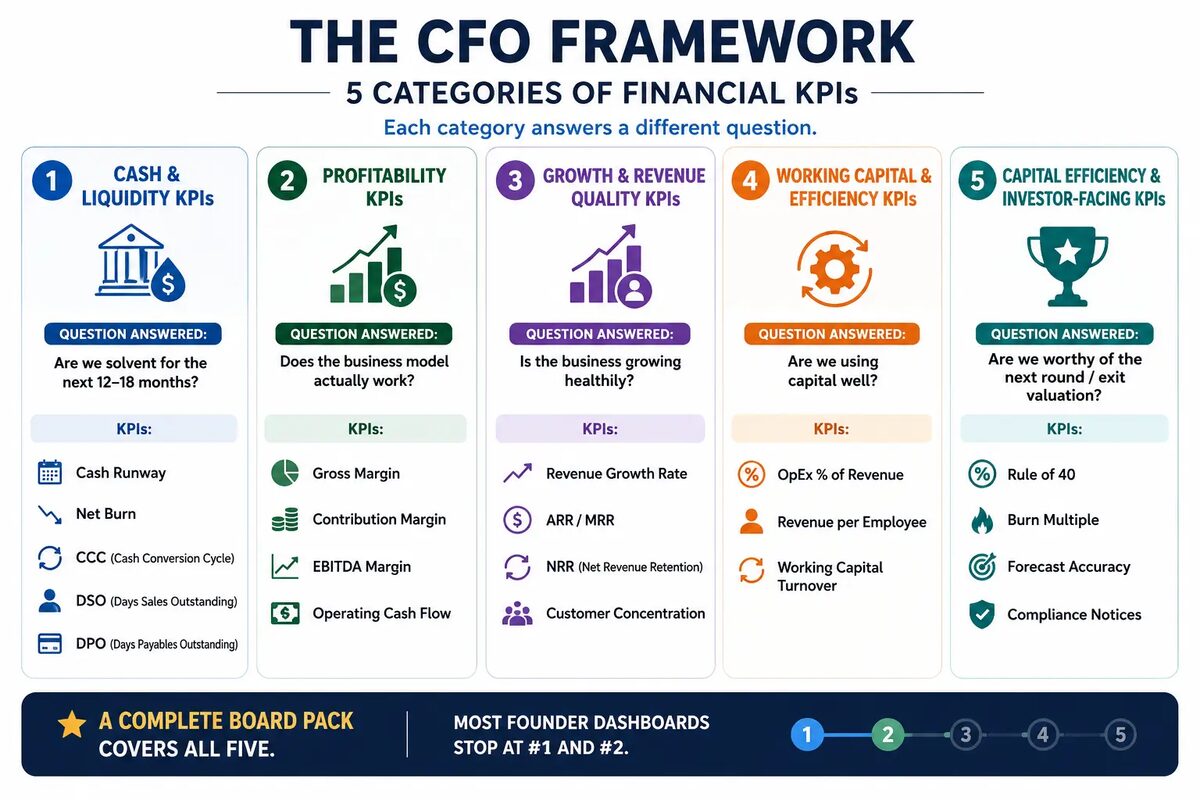
The CFO Framework — 5 Categories of Financial KPIs
Cash & Liquidity KPIs
Question answered: Are we solvent for the next 12–18 months? KPIs: Cash Runway, Net Burn, CCC, DSO, DPO.
Profitability KPIs
Question answered: Does the business model actually work? KPIs: Gross Margin, Contribution Margin, EBITDA Margin, Operating Cash Flow.
Growth & Revenue Quality KPIs
Question answered: Is the business growing in a healthy way? KPIs: Revenue growth rate, ARR/MRR, NRR, customer concentration.
Working Capital & Efficiency KPIs
Question answered: Are we using capital well? KPIs: OpEx % of revenue, revenue per employee, working capital turnover.
Capital Efficiency & Investor-Facing KPIs
Question answered: Are we worthy of the next round or exit valuation? KPIs: Rule of 40, Burn Multiple, Forecast Accuracy, Compliance Notices.
The 20 Core Financial KPIs (With Formulas & 2026 Benchmarks)
| KPI | Formula | Healthy Benchmark (2026) | Best-in-Class |
|---|---|---|---|
| Cash Runway | Cash balance ÷ Monthly net burn | 12–18 months | 18–24+ months |
| Net Burn Rate | Cash outflow − Cash inflow per month | Stage-dependent | Declining over time |
| Cash Conversion Cycle | DSO + DIO − DPO | 30–60 days | Under 30 days |
| DSO | (AR ÷ Revenue) × 365 | 30–75 days (sector-dependent) | Under 30 days |
| DPO | (AP ÷ COGS) × 365 | 45–75 days | 75–90 days (negotiated) |
| Gross Margin | (Revenue − COGS) ÷ Revenue | 30–85% (sector-dependent) | SaaS 80%+, D2C 50%+ |
| Contribution Margin | (Revenue − Variable Costs) ÷ Revenue | Positive at unit level | 50%+ (SaaS) |
| EBITDA Margin | EBITDA ÷ Revenue | Stage-appropriate | 15–25%+ at Series C |
| Operating Cash Flow | Cash from operations | Positive and growing | Growing faster than revenue |
| Revenue Growth Rate | (Current period − Prior) ÷ Prior | 50%+ YoY at Series A/B | 100%+ YoY |
| NRR | (Starting ARR + Expansion − Churn) ÷ Starting ARR | 100–110% | 120%+ |
| Customer Concentration | Top 10 customers ÷ Total revenue | Under 40% | Under 30% |
| OpEx % of Revenue | OpEx ÷ Revenue | Declining 200–400 bps YoY | Falling to stage benchmark |
| Revenue per Employee | Revenue ÷ Full-time employees | ₹40L–₹1.5 Cr (SaaS); varies by sector | Top quartile for sector |
| Working Capital Turnover | Revenue ÷ Working Capital | 4–8x | Above 8x |
| Rule of 40 | Revenue Growth (%) + EBITDA Margin (%) | 40 or above | 60 or above |
| Burn Multiple | Net Burn ÷ Net New ARR | 1.0–1.5 | Under 1.0 |
| Forecast Accuracy | Actual vs. forecast variance at EBITDA | ±5% | ±3% |
| Compliance Notice Count | GST / TDS / ROC notices received | 0 | 0 |
| Free Cash Flow Margin | FCF ÷ Revenue | Positive at growth stage | 10–25%+ at maturity |
A CFO running this 20-KPI scorecard with a monthly variance review typically delivers ±5% forecast accuracy at EBITDA, 2–5 months of additional runway per year through working capital discipline, and zero compliance notices — all measurable, not aspirational.
For a deeper view on what a senior CFO actually charges to build and maintain this system, see our guide on fractional CFO cost in India for 2026.
KPI Benchmarks by Business Model — SaaS vs. D2C vs. Manufacturing vs. Services
| KPI | SaaS | D2C / E-commerce | Manufacturing | Services |
|---|---|---|---|---|
| Gross Margin | 70–85% | 40–60% | 25–45% | 50–70% |
| DSO | 30–45 days | 0–15 days | 45–75 days | 30–60 days |
| Cash Conversion Cycle | 20–40 days | 15–35 days (often inventory-heavy) | 60–100 days | 25–55 days |
| Rule of 40 | ≥ 40 | Not a standard benchmark — use gross margin + growth instead | Not a standard benchmark | ≥ 30 (adapted) |
| NRR | ≥ 110% | Not typically tracked — repeat purchase rate is the analog | Not applicable | ≥ 100% |
| OpEx % of Revenue | 40–60% at scale | 25–40% | 15–25% | 30–50% |
Why this matters: a manufacturing CFO chasing a SaaS-style Rule of 40 is optimising for the wrong game. A D2C CFO worrying about a 45-day DSO is looking at the wrong problem — the real leak is usually in return rates and marketplace payout cycles, not customer collections. Benchmark selection is itself a CFO judgment call, and it's the single most common place we see founder-built dashboards go wrong.
KPIs by Funding Stage — What to Track From Pre-Seed to Series C+
Which of the 20 KPIs matter most also shifts by stage. Tracking all 20 with equal intensity at pre-seed is as wasteful as ignoring Rule of 40 at Series B.
| Stage | Must-Track KPIs | "Green" Benchmarks |
|---|---|---|
| Pre-Seed / Seed | Cash Runway, Net Burn Rate, Gross Margin | 18+ months runway, 60%+ gross margin |
| Series A | NRR, ARR Growth Rate, Burn Multiple | NRR above 100%, Burn Multiple below 2.0 |
| Series B | Rule of 40, EBITDA Margin, DSO | Rule of 40 above 40 |
| Series C+ | All 20, plus FCF Margin, Revenue per Employee | Rule of 40 above 60, FCF positive |
Investors calibrate to stage too — a Series A partner asking about EBITDA margin before NRR is asking the wrong question, and a founder who knows that earns credibility just by reframing the answer correctly.
India-Specific Financial KPIs That Matter
Five operational KPIs that don't appear in global KPI lists but matter heavily for an India-headquartered business:
| KPI | Why It Matters in India |
|---|---|
| GST ITC Capture Rate | Mismatches with GSTR-2B can leak 0.5–2% of revenue in unclaimed input tax credit |
| MSME Payment Compliance (45-day rule) | Section 43B(h) of the Income Tax Act disallows late payments to MSME vendors as a tax-deductible expense |
| Advance Tax Accuracy | Sections 234B/234C levy interest on incorrect quarterly advance tax instalments |
| FC-GPR Filing Status (Foreign-Owned Entities) | 30-day FEMA reporting deadline for foreign investment; delays trigger compounding late-filing penalties |
| Multi-State GST Reconciliation | Each state of operation requires a separate GSTIN and separate monthly/quarterly filings |
A senior CFO adds these to the global 20-KPI stack. The payoff shows up in clean audits, fully deductible vendor payments, and FEMA filings with no compounding charges. Generic CA firms tracking only the global 20 miss this layer entirely — which is one reason the specific advisory partner you choose matters as much as the firm's brand.
How This Compares to Global CFO KPI Standards
The core 20-KPI framework above adapts CFO KPI standards used globally by bodies like the AICPA and CFO peer networks — cash, profitability, growth, efficiency, and investor-facing metrics are universal categories in any serious finance function, whether the business is in Bangalore or Boston. What changes for an India-headquartered company is the layer underneath: GST-specific cash leakage, the MSME 45-day payment rule, FEMA filing deadlines, and multi-state GST reconciliation don't exist in a US or UK CFO's KPI set at all. A CFO KPI dashboard built for India has to run both layers — the global 20 for investor and board credibility, and the five India-specific KPIs for regulatory survival. Neither layer alone is sufficient.
How to Build a CFO-Grade Financial KPI Dashboard
- Define every KPI in writing. Numerator, denominator, exclusions, refresh cadence, owner.
- Reconcile data sources. GL → CRM → product → payroll → bank. Each KPI needs a clean upstream feed.
- Set targets, not just baselines. A KPI without a target is decoration.
- Build the visual layer. One page, traffic-light variance, trend over 4–8 quarters.
- Assign one owner per KPI. No orphan KPIs — each one has a leader who explains variance.
- Install the weekly Monday review. 30 minutes. Any variance above 5% gets explained on the spot.
- Iterate quarterly. Kill KPIs no one reads. Add KPIs the business now needs.
The single biggest predictor of a useful dashboard isn't tooling — it's discipline. A 10-tab Google Sheet reviewed every Monday beats a fancy BI tool reviewed once a month.
Want to skip the build? Jordensky's 20-KPI CFO Dashboard Template (Google Sheets) comes pre-built with formulas, sector benchmarks, and the weekly variance-review format described above. Talk to a CFO to get a copy set up for your business.
Common KPI Mistakes Founders and CFOs Make
This is where most dashboards quietly fail — not from lack of data, but from a handful of repeatable errors:
- Tracking too many. 80 KPIs, 0 decisions.
- Inconsistent definitions. "Active user" means something different to sales than to product.
- No reconciliation to the model. The dashboard says one thing; the financial model says another.
- Quarterly-only reviews. By quarter-end, the miss is three months old.
- No cohort view. Aggregate KPIs hide bad cohorts inside good averages.
- No segment cut. The top 10 customers behave very differently from the long tail.
- Trailing metrics only. Activation, time-to-value, and engagement predict churn before it shows up in NRR.
- No leading indicators. Pipeline, conversion rate, and sales velocity tell you next quarter's bookings today.
- Tracking output, not productivity. "We did 100 demos" tells you nothing without a conversion rate attached.
- KPIs without owners. Drift is inevitable when no one's name is on the number.
- No targets in compensation. Behaviour doesn't change without skin in the game.
- Ignoring forecast accuracy. It's the meta-KPI that tells you whether to trust the other 19.
Expert CFO Tips for KPI Discipline
- Pick 15–20, not 80. Less is more.
- Define every metric in writing — source of truth, owner, formula.
- Reconcile to the financial model monthly. Investors will check.
- Trend over 4–8 quarters, not point-in-time. Anyone can have one great month.
- Run weekly variance reviews. Variance above 5% → owner explains, same time every Monday.
- Tie KPI targets to compensation. Put leadership variable pay on 3–5 KPIs.
- Build cohort retention curves. The most underused, most predictive view in most dashboards.
- Audit the dashboard quarterly. Kill what no one reads.
- Pair a leading indicator with a lagging indicator for every goal.
- Bring KPIs into the founder–CFO weekly 1:1. Make them the language of leadership, not just finance.
How KPIs Tie Into Fundraising and Investor Confidence
In 2026, nearly every diligence call opens with the same five KPIs:
- ARR / Revenue + Growth Rate
- Gross Margin
- Net Revenue Retention
- Burn Multiple
- Cash Runway
Add the Rule of 40 for SaaS businesses, and you have the entire investor mental model in six numbers.
A founder who can present these — with trends, with cohorts, with sensitivity — gets a faster yes. A founder who fumbles them gets a polite "let's stay in touch." The CFO who builds and maintains this system is arguably the most leveraged hire a founder makes between seed and Series B — which is exactly why what a CFO actually does at Series A is worth understanding before you hire one.
Jordensky's MIS & Reporting team has built financial KPI systems for 100+ Indian startups and SMEs. We define the metrics, build the dashboard, install the weekly cadence, and reconcile everything to your financial model — so every board pack and investor update runs on numbers that hold up in diligence.
Talk to a CFO →
30-minute consultation. No commitment. CFO-level insights, not a sales pitch.
Frequently Asked Questions
1. What financial KPIs should a CFO monitor?
The core 20 are cash runway, net burn rate, cash conversion cycle, DSO, DPO, gross margin, contribution margin, EBITDA margin, operating cash flow, revenue growth rate, ARR/MRR, NRR, customer concentration, OpEx % of revenue, revenue per employee, working capital turnover, Rule of 40, Burn Multiple, forecast accuracy, and compliance notice count.
2. What is the most important financial KPI for a startup?
There isn't a single universal answer — it depends on stage. Pre-revenue and early-revenue startups should watch Cash Runway above all else, since it determines how much time exists to hit the next milestone. Post-Series A, Net Revenue Retention typically becomes the more important signal, because it shows whether growth is durable or borrowed.
3. What KPIs do VCs look at during due diligence?
Almost every diligence process opens with five: ARR or revenue and its growth rate, gross margin, Net Revenue Retention, Burn Multiple, and cash runway. SaaS investors add Rule of 40 as a sixth. Founders who can present these with trend lines and cohort detail move through diligence faster.
4. What is a good gross margin for an Indian startup?
It depends heavily on business model. SaaS companies should target 70–85%, services businesses 50–70%, D2C/e-commerce brands 40–60%, and manufacturing businesses 25–45%. A "good" gross margin is one that's stage-appropriate and improving, not a fixed number in isolation.
5. How do I calculate cash runway?
Cash Runway = Current cash balance ÷ Average monthly net burn rate. A business with ₹6 crore in the bank and a ₹50 lakh average monthly net burn has 12 months of runway. Recalculate monthly, since both the cash balance and the burn rate change.
6. What is the difference between NRR and GRR?
Gross Revenue Retention (GRR) measures pure retention from the existing customer book without any expansion revenue, and caps at 100%. Net Revenue Retention (NRR) includes expansion revenue and can exceed 100% if existing customers are growing their spend faster than others churn. Best-in-class SaaS businesses target NRR of 120% or higher.
7. What financial metrics should I show investors?
Lead with the five diligence-standard KPIs — ARR/revenue growth, gross margin, NRR, Burn Multiple, and cash runway — then layer in Rule of 40 for SaaS or category-appropriate profitability metrics for other business models. Show trends across 4–8 quarters, not a single snapshot; investors discount point-in-time numbers heavily.
8. Why should founders care about CFO KPIs?
Because investors and acquirers speak this language. Founders fluent in these KPIs raise capital faster, at better valuations, make better operating decisions, and run more credible board meetings. The CFO maintains the system; the founder owns the outcomes.
9. What is the Rule of 40?
Rule of 40 = Revenue Growth Rate (%) + EBITDA Margin (%). A score above 40 is healthy and above 60 is excellent. It's the default 2026 investor anchor for SaaS businesses, balancing growth and profitability into a single number — though it doesn't apply cleanly outside recurring-revenue models.
10. What is a good Burn Multiple?
Burn Multiple = Net Burn ÷ Net New ARR. Below 1.0 is outstanding, 1.0–1.5 is good, and 2.0 or above is a red flag. It's the metric that exposes "growth at any cost" strategies that Rule of 40 alone can miss.
11. How often should a CFO review financial KPIs?
Daily for cash position and AP/AR exceptions. Weekly for cash runway, DSO, top-line, and retention pulse. Monthly for the full 20-KPI dashboard with variance commentary. Quarterly for the full board-level review.
12. What's the difference between gross margin and contribution margin?
Gross margin = (Revenue − COGS) ÷ Revenue, and includes only the direct cost of revenue. Contribution margin = (Revenue − Variable Costs) ÷ Revenue, and also nets out variable selling and operating costs. Both matter; contribution margin is generally more useful for pricing decisions.
13. What is a healthy DSO for an Indian SME?
It's sector-dependent: SaaS B2B typically runs 30–45 days, D2C 0–15 days, services 30–60 days, manufacturing 45–75 days, and enterprise sales 60–90 days. Track DSO alongside the on-time payment rate to avoid straining customer relationships while chasing collections.
14. What is forecast accuracy and why is it a meta-KPI?
Forecast accuracy is the variance between actual and forecast results at the EBITDA line, typically measured quarterly. ±5% is the bar for a mature CFO function. It's called a meta-KPI because it tells you whether to trust the other 19 numbers on the dashboard.
15. Can I build the CFO dashboard in Excel, or do I need a BI tool?
For most businesses in the ₹5–50 crore revenue range, a well-structured Excel or Google Sheet works fine. Discipline matters more than tooling. Above roughly ₹50 crore revenue, dedicated BI tools (Power BI, Looker, Cube) start adding real value through live data feeds and self-service drill-downs.
Final Takeaway — A CFO Without KPIs Is a Filer. A CFO With KPIs Is a Lever.
The companies that compound in 2026 don't track 80 KPIs. They track 20 — the right 20 for their stage and business model — with a weekly cadence, a defined owner, a written target, and a variance review every Monday morning.
Founders, you don't need to build the dashboard. But you need to read it. Investors speak this language. Boards speak this language. The 30 seconds it takes to look at the dashboard each Monday compounds into a quarter where you actually run the business — instead of being run by it.
CFOs, you don't need 80 KPIs. You need the 20 above, defined, reconciled, owned, and explained. Build them once. Refresh them weekly. Defend them in every diligence call.
That's the difference between a finance department and a CFO function.